View Data as a Report
Summary
Learn how to open a report and visualize data as graphical representations. These data visualizations help you observing data and taking informed decisions.

There are two kings of reports that a Designer might have plugged in the application.
- Dashboard () This graphical representation visualizes data without taking in account the Properties nor the table's restrictions.
- Reports () This graphical representation visualizes data considering the Properties that filter the table and the table's restrictions.
Info
See Create sub-sets of data from filters: Properties for more information about the Properties
Note
The Designer decides to enable either a Dashboard or a Report or both according to the application and workflow.
Opening a Dashboard
Click on the icon in the upper-right corner of the toolbar.
The action leads to the Dashboard panel. In the Dashboard panel, you can view the data graphical representation.
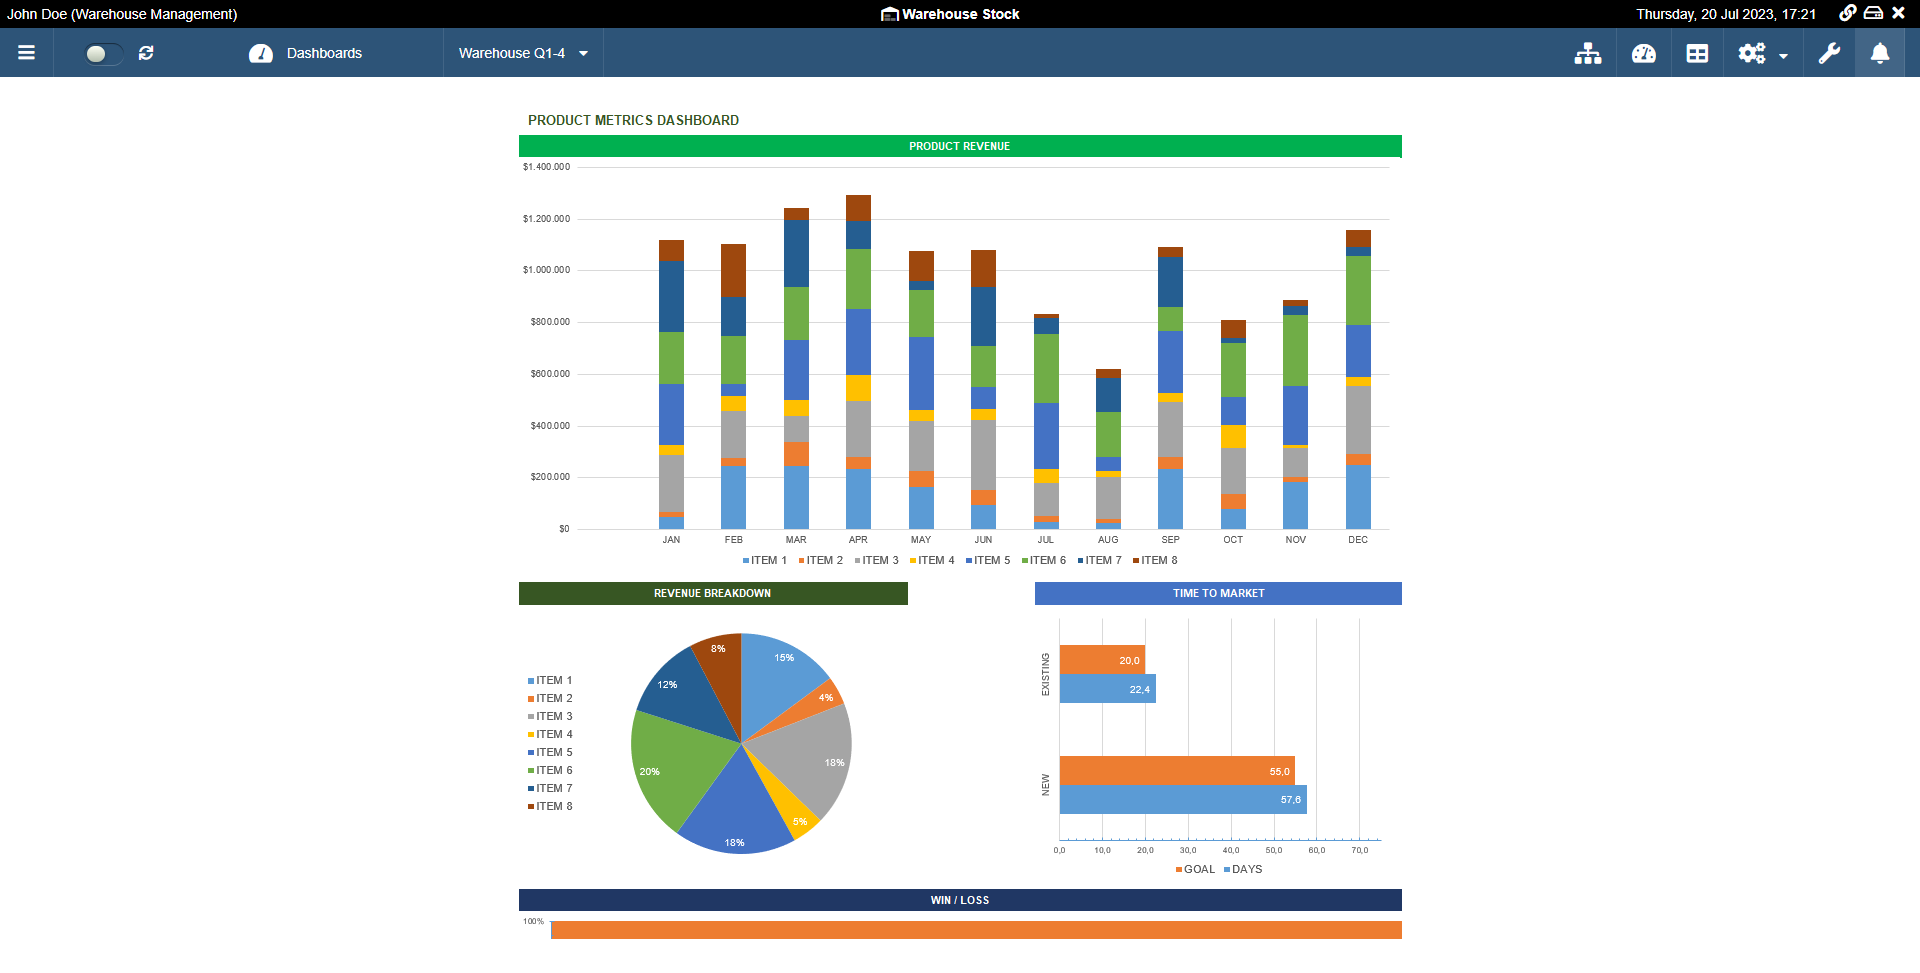
If the Designer has plugged multiple Dashboards, you can choose which Dashboard to view by choosing from the drop-down list.

Click on in the upper-right corner of the panel to go back to the table.
Opening a Report
Click on the icon in the upper-right corner of the toolbar.
The action leads to the Report panel. In the Report panel, you can view the data graphical representation that considers Properties and restrictions on the table.

If the Designer has plugged multiple Report, you can choose which Report to view by choosing from the drop-down list.

Click on in the upper-right corner of the panel to go back to the table.