How to Integrate and View a Data Visualization Report
Required Permissions
This section requires the Application Designer permission from your Domain's administrator.
Check What are the Design Tasks? to learn more about permissions to work with Design Mode and other tools.
Summary
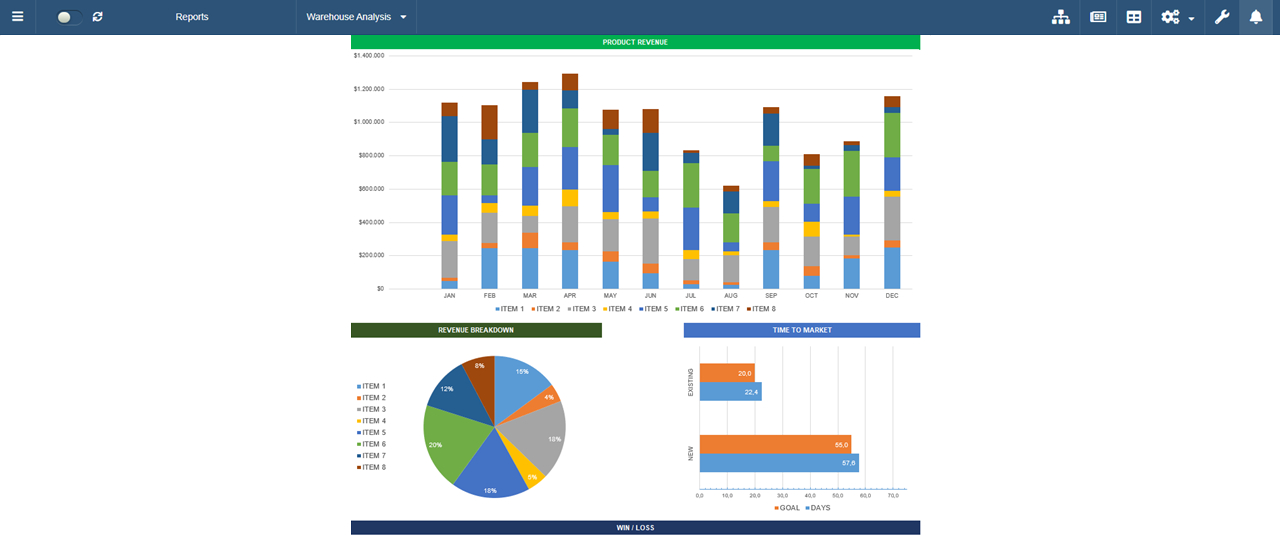
Designers can integrate data visualization systems in their applications to view graphical reports.
eLegere offers two ways to visualize data in an application through a data visualization system: Dashboards and Reports.
Differences Between Dashboards and Reports
Choose either a Dashboards or a Reports to visualize data according to your needs.
The table below summarizes the key differences between Dashboards and Reports.
| Dashboard | Reports |
|---|---|
| Opens a link to the external data visualization system without interacting with the application's table. Dashboards do not access the application's data. | Represents the application's tables data through the data visualization system. Reports send the application's data to the data visualization system. Reports consider the active restrictions and Properties. |
Hint
If you need to view the application's data through the data visualization system considering active Properties, configure a Report instead of a Dashboard.
How to Configure a Dashboard
Dashboards display an external report from a data visualization system. Dashboards do not access the data from the application's tables.
Learn how to configure a Dashboard in the Design Mode.
Add a Dashboard
Follow the steps below to integrate a data visualization system as a Dashboard in your application.
-
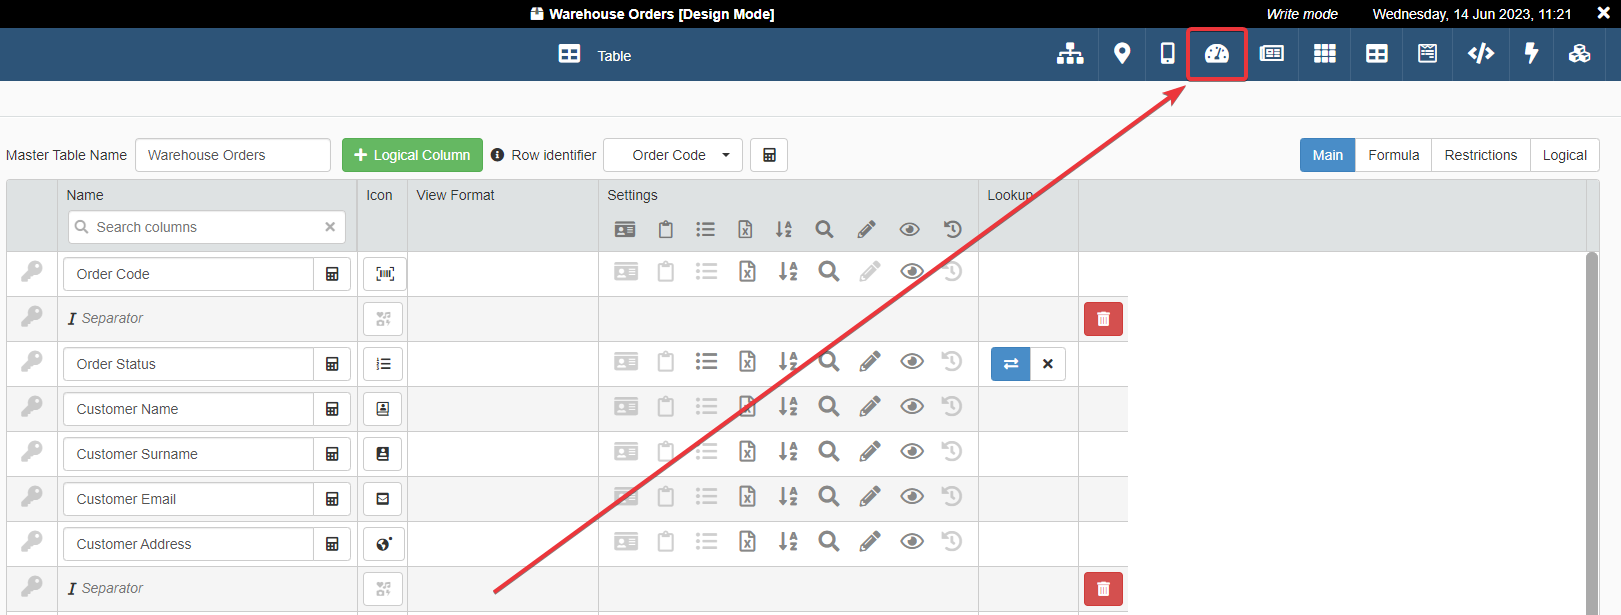
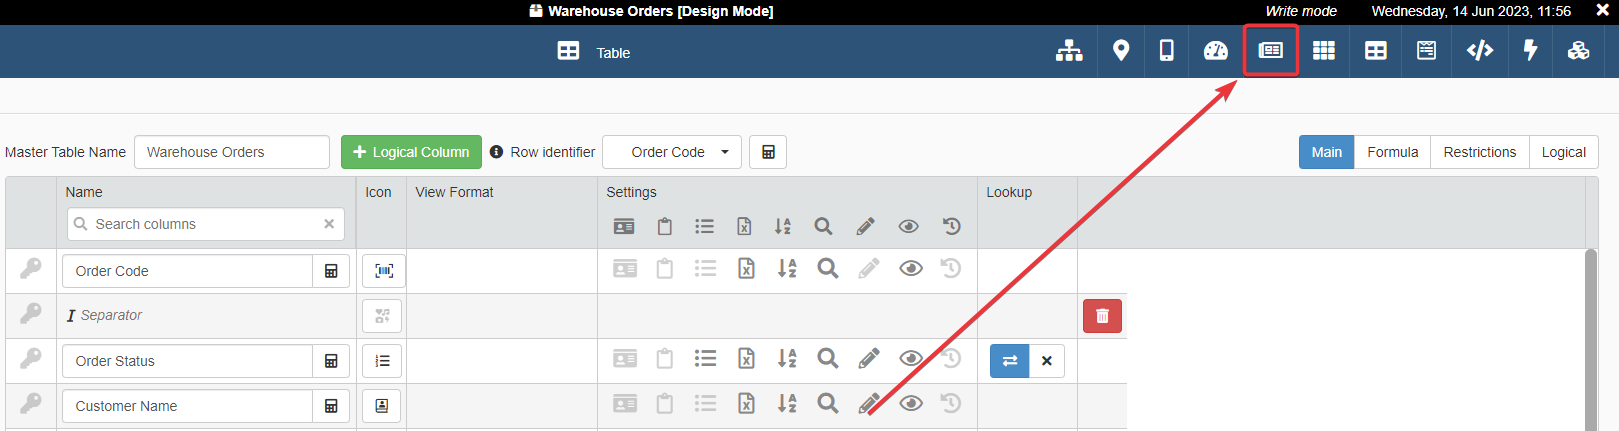
In any point of the Design Mode, click on the icon on the top-right corner. You will access the Dashboard panel to configure Dashboards.
-
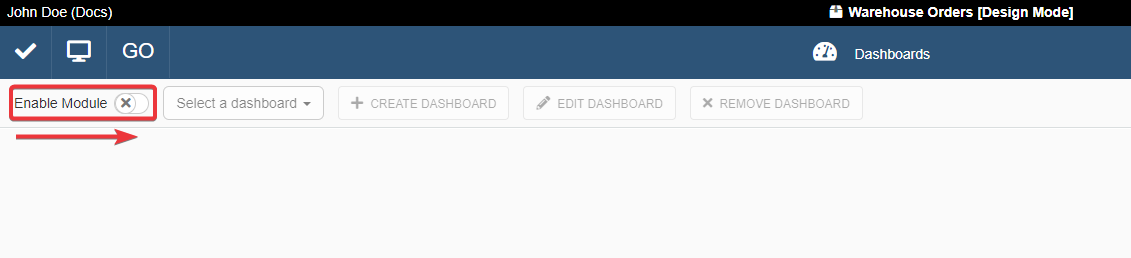
In the Dashboard panel, click on the Enable Module toggle switch to enable Dashboards in the application.
-
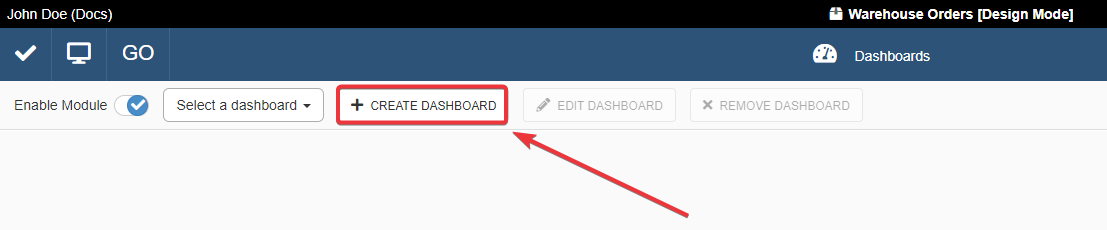
Click on the Create Dashboard button to add a new Dashboard to the application.
-
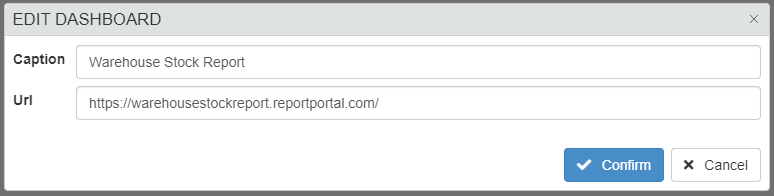
The action at step 3 opens the Create Dashboard window.
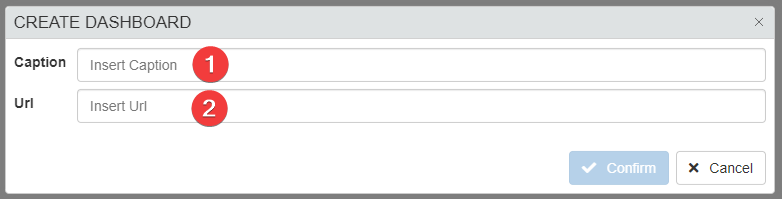
- (1) Caption Insert a name to label the Dashboard.
- (2) Url Insert the Url to connect the data visualization system.
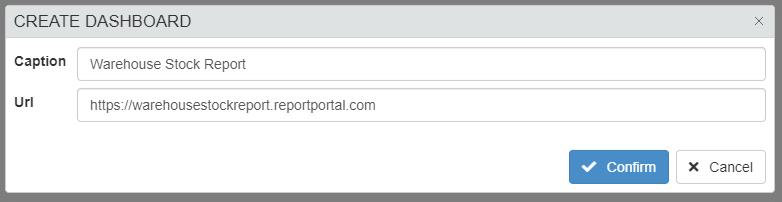
Example
-
Click on the Confirm button to save the Dashboard or the Cancel button to abort the operation.
-
Click on the Save button () in the top-left corner to save all the changes in Design Mode.

Success
You have created a Dashboard for your application.
Edit a Dashboard
Follow the steps below to edit the settings of a Dashboard.
-
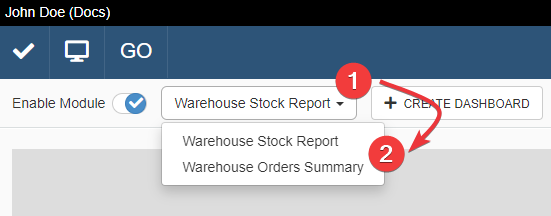
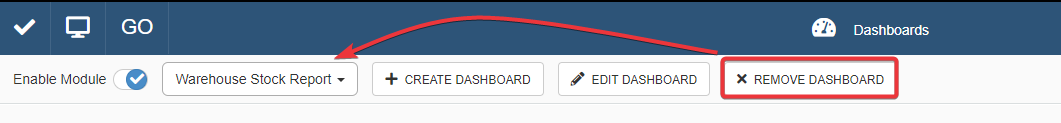
All the application's Dashboards will appear in a drop-down list in the Dashboard's panel. Click on the drop-down list (1) and choose (2) from the list the Dashboard to be edited.
-
Click on the Edit Dashboard button in the Dashboard's panel to edit the Dashboard.
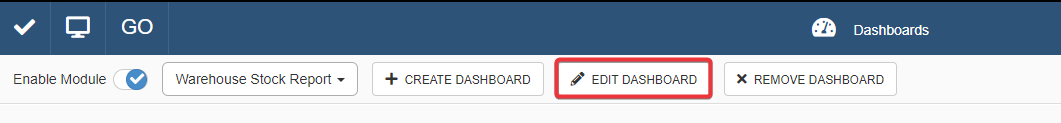
The action opens the Edit Dashboard window where you can modify any information.
-
After the edit, click on the Confirm button to save the changes or the Cancel button to abort the operation.
-
Click on the Save button () in the top-left corner to save all the changes in Design Mode.
Success
You have edited the Dashboard's configuration.
Remove a Dashboard
Follow the steps below to delete a Dashboard.
-
All the application's Dashboards will appear in a drop-down list in the Dashboard's panel. Click on the drop-down list (1) and choose (2) from the list the Dashboard to be deleted.
-
You can delete the selected Dashboard by clicking on the Remove Dashboard button in the Dashboard's panel.
-
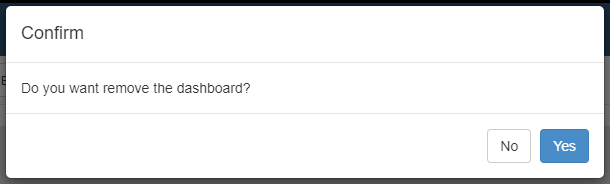
A window will ask confirmation to delete the chosen Dashboard. Click on the Yes button to confirm or No to abort the deletion.
-
Click on the Save button () in the top-left corner to save all the changes in Design Mode.
Success
You have removed the Dashboard from the application. The users won't access anymore that particular Dashboard.
How to Configure a Report
Reports send to the data visualization system both the application's tables' data and the active restrictions and Properties.
Learn how to configure a Report in the Design Mode.
Attention
eLegere passes the set of restrictions and Properties to the data visualization system in a specific way.
If you manage the data visualization system or you work with the eLegere database directly, check Context for Reports and Webforms with Row Restrictions to learn more about how eLegere manages the data passed to the Report.
Add a Report
Follow the steps below to integrate a data visualization system as a Report in your application.
-
In any point of the Design Mode, click on the icon on the top-right corner. You will access the Report panel to configure Reports.
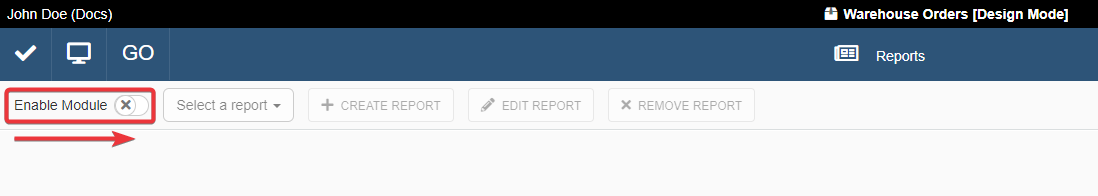
-
In the Report panel, click on the Enable Module toggle switch to enable Reports in the application.
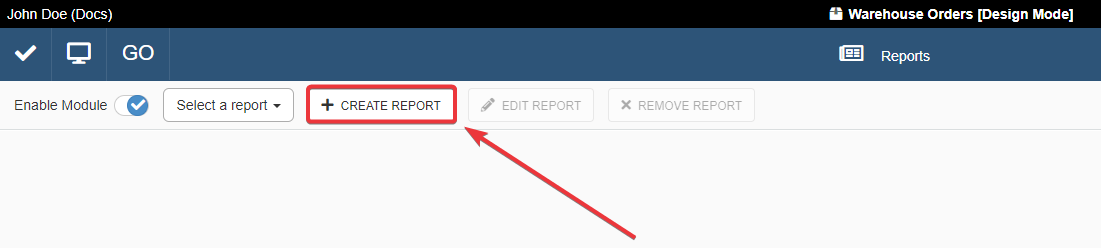
-
Click on the Create Report button to add a new Report to the application.
-
The action at step 3 opens the Create Report window.
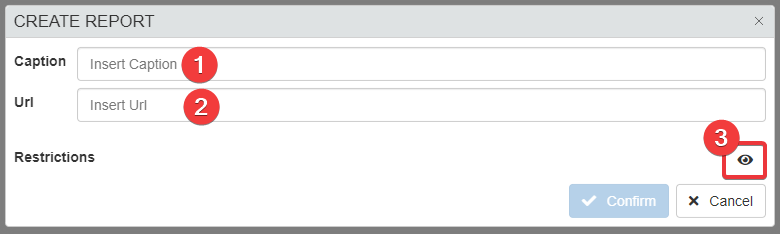
- (1) Caption Insert a name to label the Report.
- (2) Url Insert the Url to connect the data visualization system.
- (3) Visibility Restriction
optionalIf you want to display the Report only under certain conditions, click this button to open the Formula Editor and insert a Formula defining the conditions.
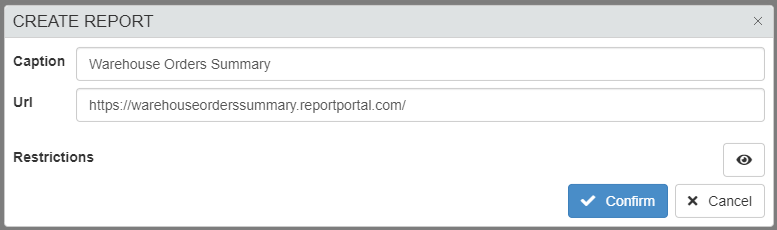
Example
-
Click on the Confirm button to save the Dashboard or the Cancel button to abort the operation.
-
Click on the Save button () in the top-left corner to save all the changes in Design Mode.

Success
You have created a Report for your application.
Arrange the Reports in the Application
All the application's Reports will appear in a drop-down list in the Report's panel.
By default, the application displays the Report positioned in the drop-down list's first position.
Arrange the list by Drag & Drop the Reports through the icon. The first Report dragged at the list's top will be the first to appear in the application. The other Reports will appear in the order you have arranged in the drop-down list.
Click on the Save button () in the top-left corner to save all the changes in Design Mode.
Success
You have positioned a Report as the first to be displayed in the application.
Edit a Report
You can edit a selected Report by clicking on the Edit Report button in the Report's panel.
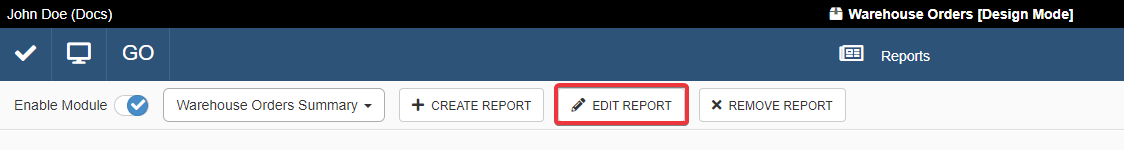
The action opens the Edit Report window where you can modify any setting.
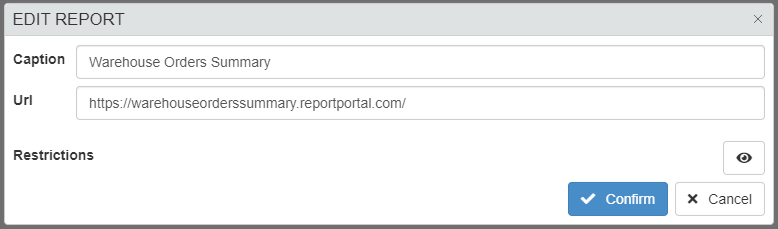
After the edit, click on the Confirm button to save the changes or the Cancel button to abort the operation.
Click on the Save button () in the top-left corner to save all the changes in Design Mode.
Success
You have edited the Report's configuration.
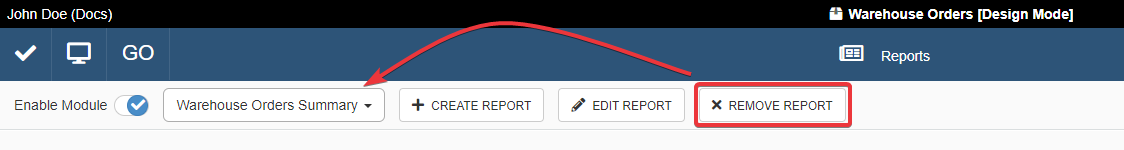
Remove a Report
You can delete the selected Report by clicking on the Remove Report button in the Report's panel.
A window will ask confirmation to delete the chosen Report. Click on the Yes button to confirm or No to abort the deletion.
Click on the Save button () in the top-left corner to save all the changes in Design Mode.
Success
You have removed the Report from the application. The users won't access anymore that particular Report.